Initiating Coverage | Luggage
February 21, 2018
Safari Industries
BUY
CMP
`532
On a fast paced ‘Safari’
Target Price
`650
Safari Industries Ltd (Safari ) is the third largest branded player in the Indian
Investment Period
12 Months
luggage industry. Post the management change in 2012, it has witnessed
complete restructuring in business and product portfolio. This restructuring has
helped it in posting a CAGR of 42% in revenue and 46% in PAT over 2012-17. It
Stock Info
has also now captured ~14% market share in a ~`2600 cr branded luggage
Sector
Luggages
market.
Market Cap (` cr)
1,184
Favourable Industry dynamics for organized players post GST: The Indian luggage
Net Debt (` cr)
39
industry is valued at `9000cr+ and is largely dominated by the unorganized
Beta
0.3
sector. The top three branded players namely- VIP Industries, Samsonite and Safari
forms only ~28% of this market. Owing to improving economy and travel, the
52 Week High / Low
664 / 205
luggage industry has posted a 13%+ CAGR in the past decade and is expected to
Avg. Daily Volume
12,609
maintain this momentum for next few years. With GST implementation in 2017,
Face Value (`)
2
the new cost dynamics has led to industry shifting towards organized players.
BSE Sensex
33,844
On a strong growth trajectory since 2012: Post the management change in 2012,
Safari has grown its revenue by 6x in the last 7 years. This has been achieved by
Nifty
10,397
foraying in many new categories like back pack, school bags ( via acquisition of
Reuters Code
SAFA.BO
Genius and Genie) and improvement in distribution networks. Also, it adopted
Bloomberg Code
SII.IN
product rationalization & strategy realignment where non performing SKUs were
eliminated. Currently, its product are available in major 25+ cities via
3,500+
outlets.
Margins have doubled and likely to stay at 9%+ level: Its margins have more than
Shareholding Pattern (%)
doubled from 4.1% in FY2014 to 9.1% in M9FY2018, driven by launch of new
Promoters
57.8
product categories and business restructuring. This was also led by better
MF / Banks / Indian Fls
21.2
negotiation with Chinese suppliers (with increasing scale of Safari’s operations)
and relatively stable ` exchange rate. We expect it to maintain 9%+ margins from
FII / NRIs / OCBs
6.0
FY2018 onwards led by regular price hikes, shift towards organised player and
Indian Public / Others
15.0
favourable industry dynamics.
Outlook and Valuation: We expect its revenue to grow by 23% CAGR over
Abs. (%)
3m 1yr
3yr
FY2017-20E on the back of growth in its recently introduced new products. We
Sensex
1.3
18.6
14.3
expect its earnings to grow by ~59% CAGR, owing to stable operating margins
Safari
(2.4)
155.0
247.0
and its asset light model. Safari currently trades at a P/E of 40x FY2019E and 30x its
FY2020E EPS which looks attractive looking at its strong brand play story emerging in the
luggage industry. We initiate coverage on the stock with a Buy recommendation and
Target Price of `650 (36x FY2020E EPS), indicating an upside of 18%.
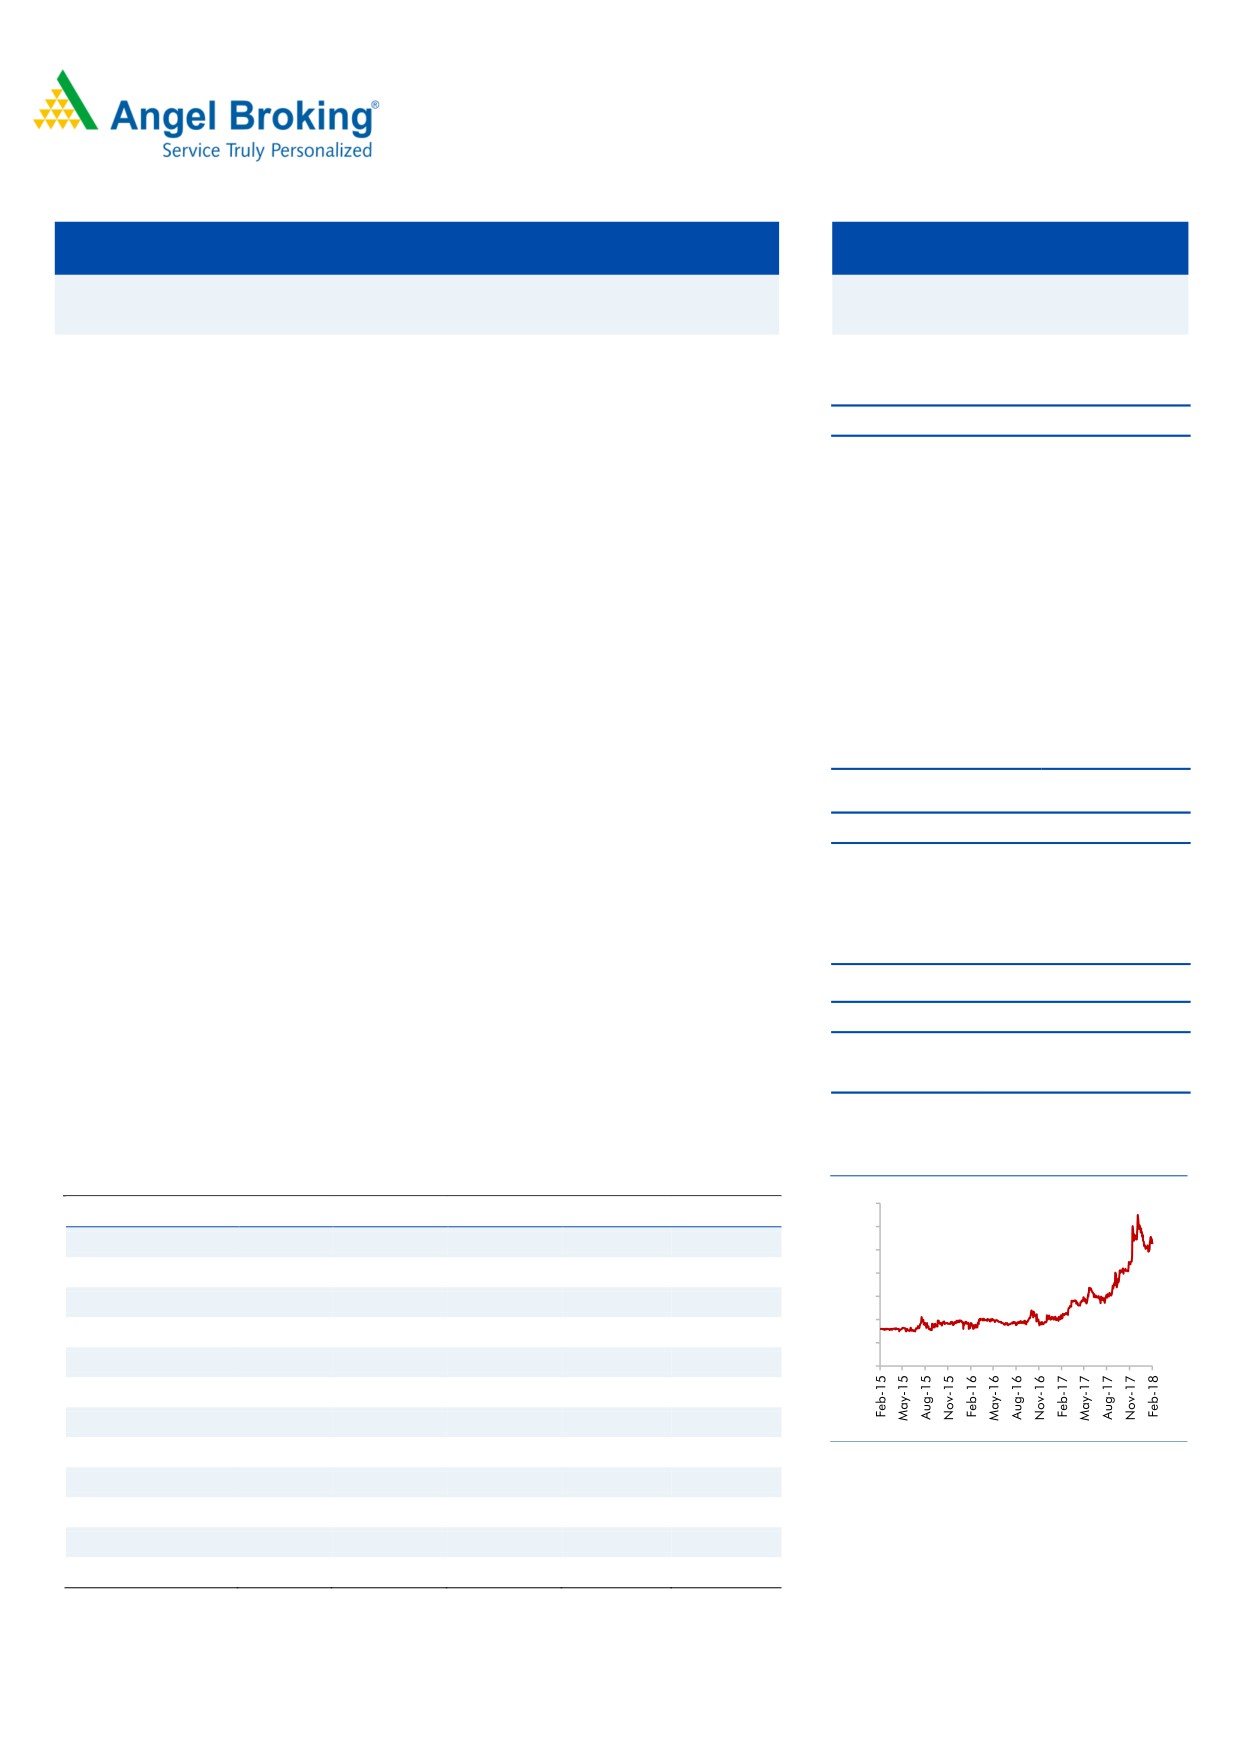
3 year daily price chart
Key financials
700
Y/E March (Rs cr)
FY2016
FY2017E
FY2018E
FY2019E
FY2020E
600
Net Sales
278
359
409
532
665
500
% chg
28.8
29.0
14.0
30.0
25.0
400
300
Net Profit
7.8
10.4
20.4
29.3
40.0
200
% chg
55.9
33.8
96.2
43.6
36.4
100
OPM (%)
6.7
6.3
9.4
9.8
10.3
0
EPS (Rs)
3.5
4.7
9.2
13.2
18.0
P/E (x)
152.1
113.7
58.0
40.4
29.6
P/BV (x)
13.1
11.9
10.0
8.2
6.5
Source: Company, Angel Research
RoE (%)
8.5
10.4
17.2
20.1
21.9
RoCE (%)
9.7
12.1
19.6
23.5
26.3
EV/Sales (x)
4.4
3.4
3.0
2.3
1.8
Nidhi Agrawal
EV/EBITDA (x)
66.8
54.4
31.6
23.3
17.7
022-39357800 Ext: 6872
Source: Company, Angel Research, Note: CMP as of February 21, 2018
Please refer to important disclosures at the end of this report
1
Initiating Coverage
Safari Industries
Company background
Safari is in the business of manufacturing and trading of luggage and luggage
accessories. Safari was incorporated in 1980 by Mr. Sumatichandra H Mehta and
it used to basically manufacture injection moulded plastic articles and vacuum
formed plastic articles, at its plants at Bombay and Halol, Gujarat. Mehta and
family. In 2012, the company was taken over by Mr Sudhir Jatia who was
previously working as MD with VIP industries. Since then there has been business
restructuring where lot of new products were introduced. The company largely
procures quality products from China and sell it under its brand Safari.
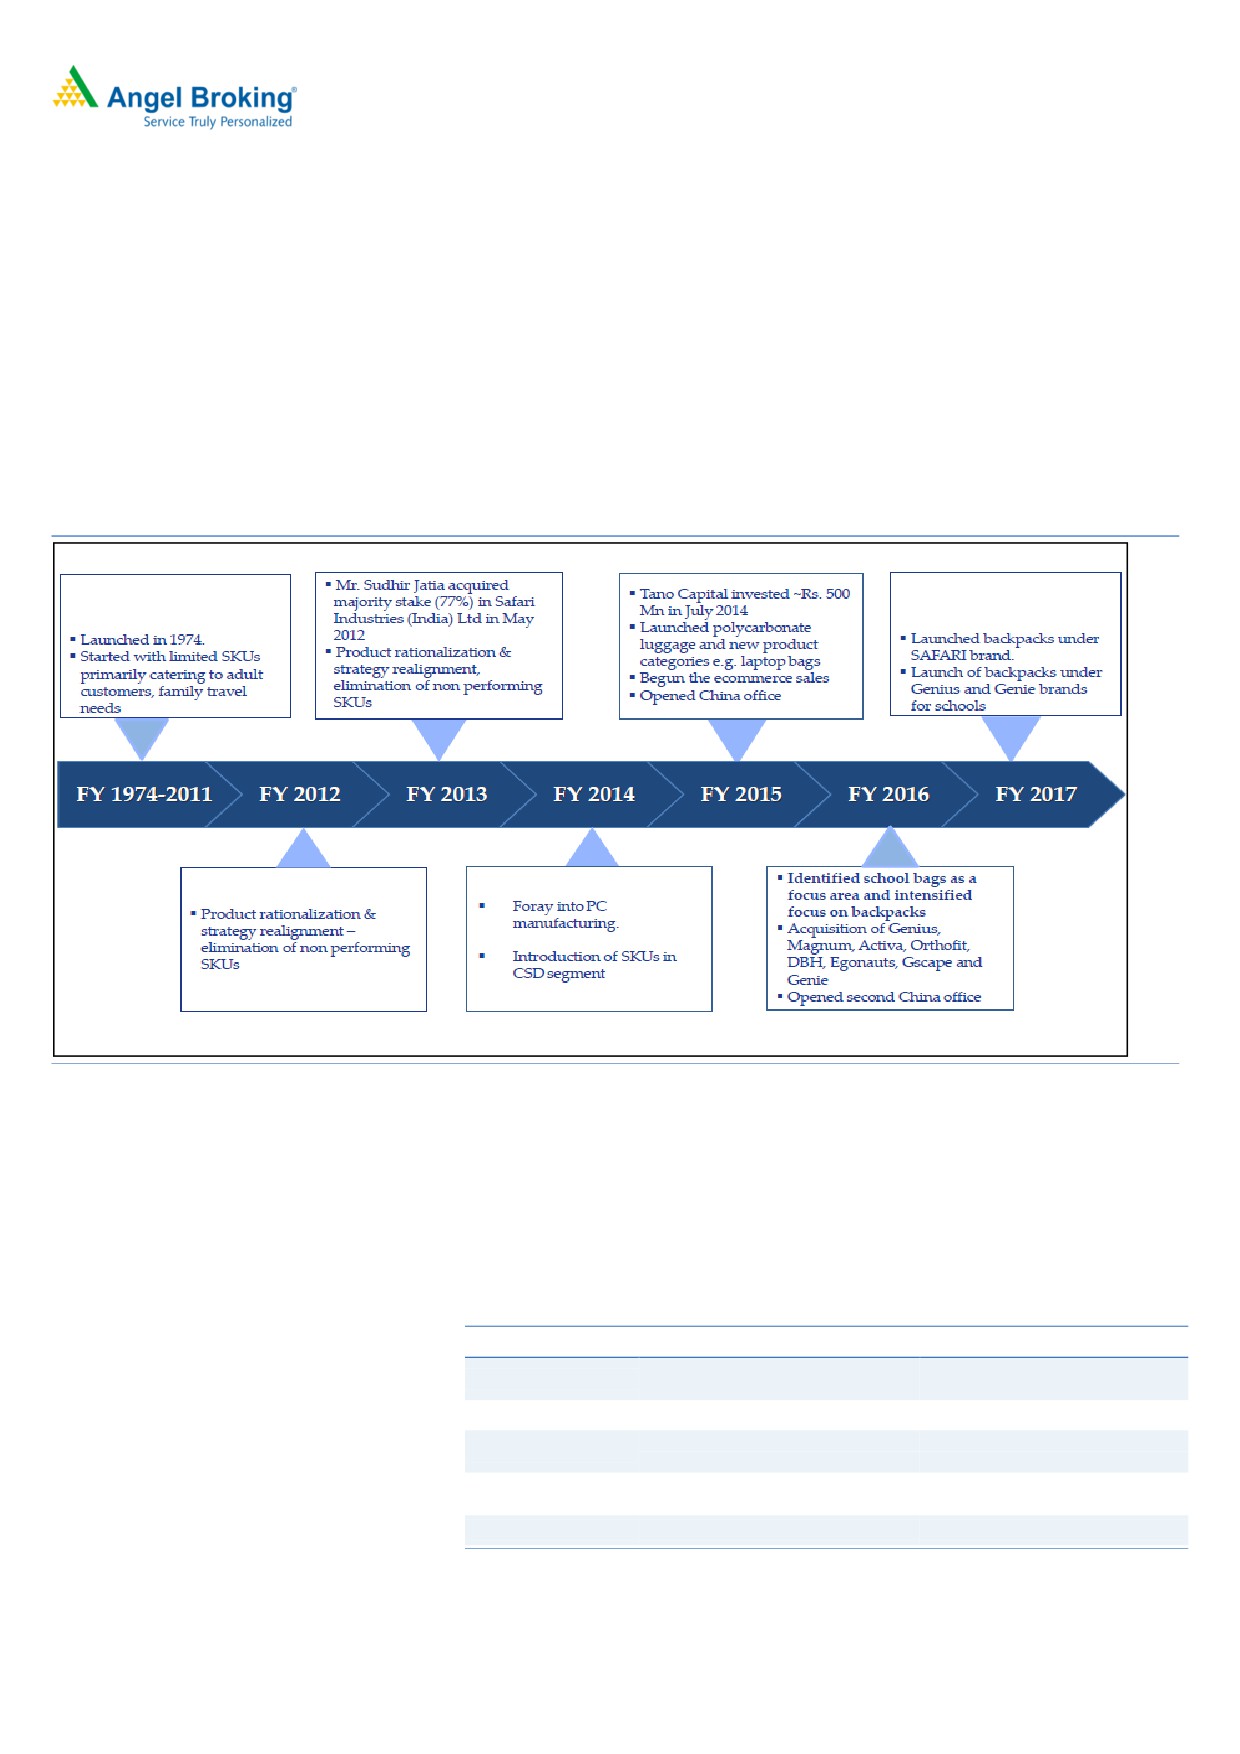
Exhibit 1: Company’s timeline
Source: Company
Product categories
There are two broad categories of luggage i.e hard luggage and soft luggage.
Hard luggages (20% of revenue) are mainly made of Poly Propylene (PP) and Poly
Carbonate (PC) and manufactured in-house by Safari at its plant located at Halol,
Gujarat. Soft luggages are made of fabrics of various kinds and are mainly
imported from China where the company has opened 2 offices for design and
procurement.
Exhibit 2: Product categories
Group
Soft Luggage
Hard Luggage
Rolling Duffle bags, Upright 2/ 4
Poly Carbonate & ABS,
Product Category
wheeler, Children bags, backpacks
PolyPropylene
Revenue Contribution 80%
20%
Branded offering in a largely
PolyPropylene-Steadily getting
Strategy
unorganized market
phased out
Poly Carbonate & ABS- Focus on
Innovating by adding features
innovative designs
Sourcing
Imported from China
Largely made in house
Source: Company, Angel Research
2
Initiating Coverage
Safari Industries
Investment Arguments
Shift in trend towards the organized sector to propel growth
1. Favourable Industry dynamics for organized players post GST
The Indian luggage industry is valued at `9000cr+ and is largely dominated by
the unorganized sector. The top three branded players namely- VIP Industries,
Samsonite and Safari forms only ~28% of this market. VIP Industries is the market
leader with over 50% market share whereas Samsonite has been losing market
share ( current at ~35% from the past level of 50%+). Backed by re infused energy
from new management, Safari has been grabbing market share in the last few
years and currently it stands at 14-15%.
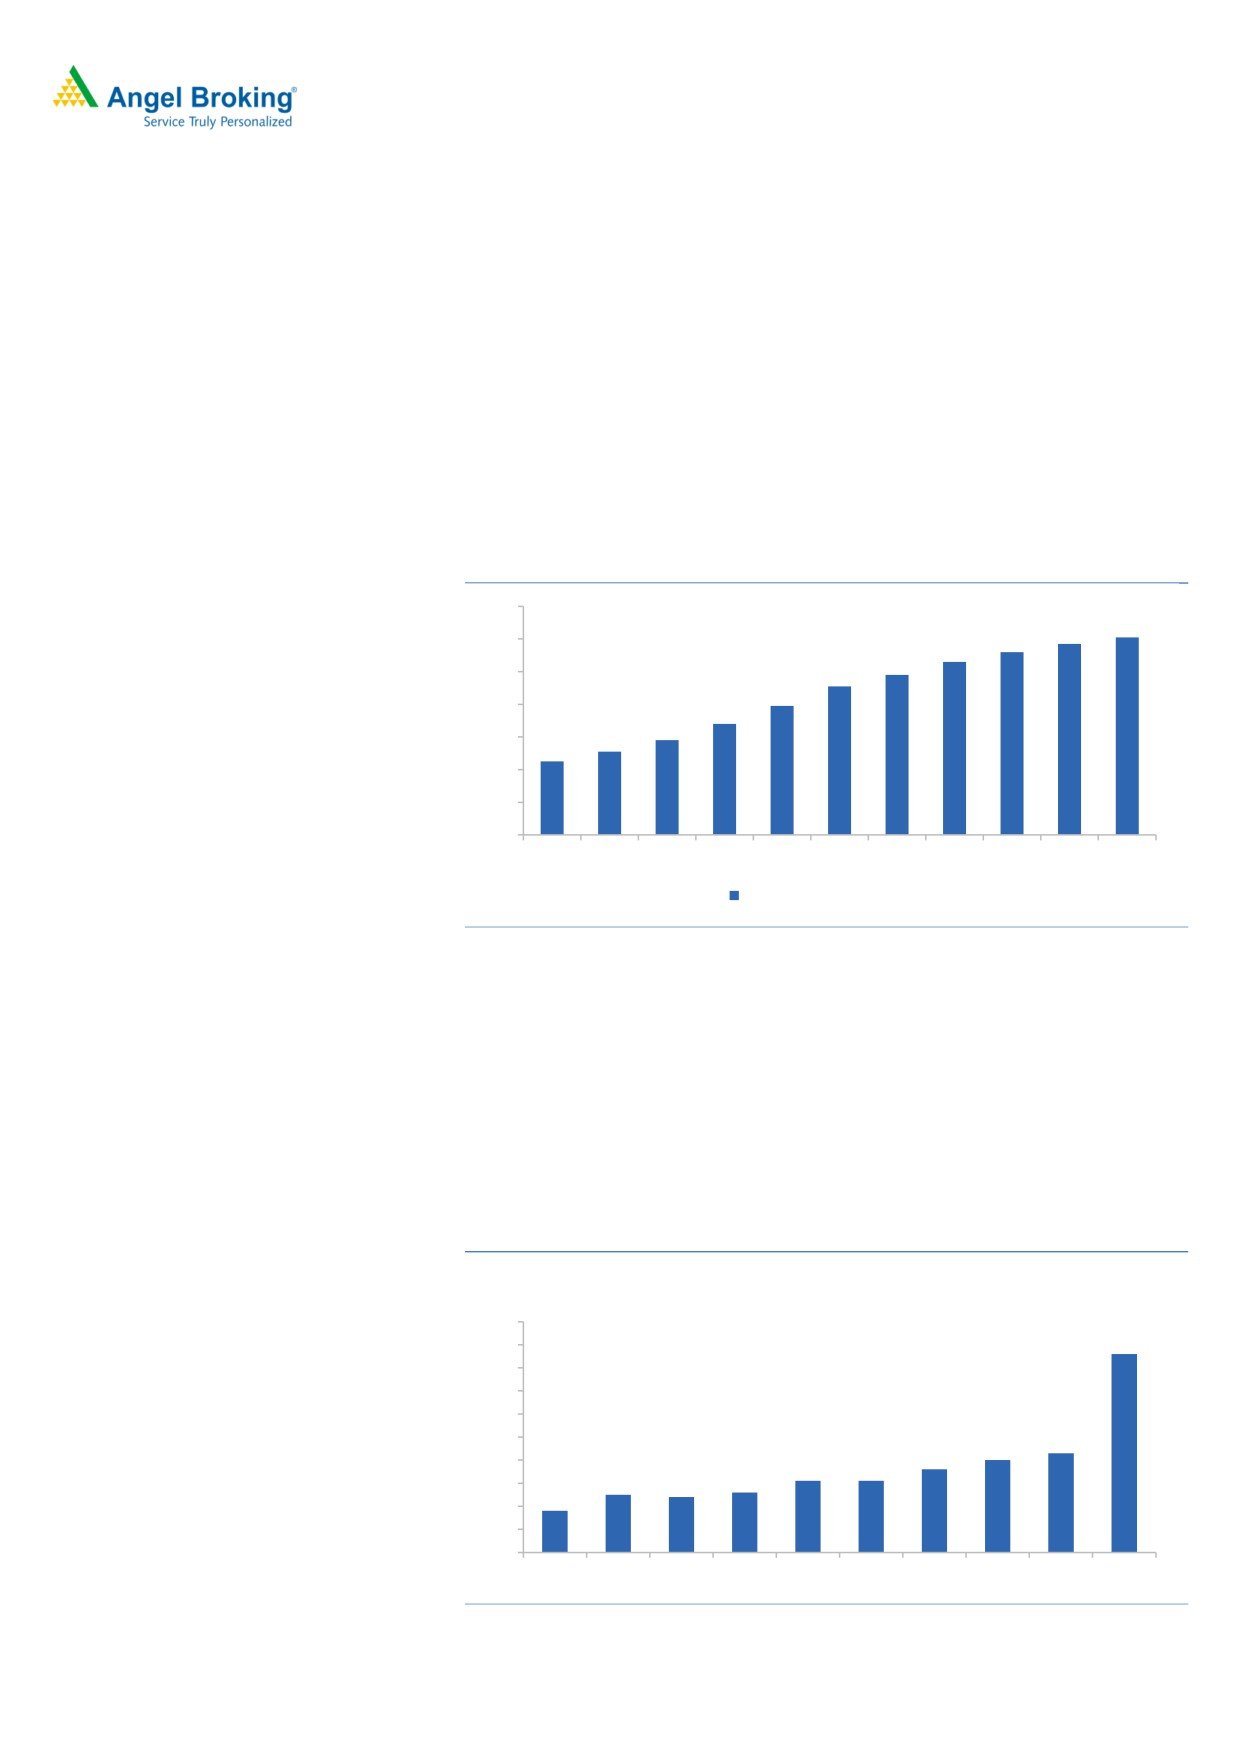
Exhibit 3: Luggage industry posted ~15% CAGR during 2011-16
140
120
100
80
60
40
20
0
FY11 FY12 FY13 FY14 FY15 FY16 FY17 FY18 FY19 FY20 FY21
Sales of Luggage (Rs Bn)
Source: Company, Angel research
2. Increasing travel and premiumization is driving the growth
Most players are coming up with more youth-orientated products like lightweight
and more efficient backpacks and duffel bags. Robust demand for luggage is led
by the fact that most youngsters now are keen on travel and adventure, increasing
demand for hands-free and hassle-free luggage. The Indian luggage industry is
likely to benefit as the people have become more demanding in term of style and
comfort for travel luggage.
Exhibit 4: Indian tourism industry growing >10% CAGR
Indian tourism industry (USD bn)
100
90
80
70
60
50
40
30
20
10
0
2006
2007
2008
2009
2010
2011
2012
2013
2015
2025E
Source: Company, Angel Research
3
Initiating Coverage
Safari Industries
3. GST has further created level field for organised players
Owing to improving economy and consumer confidence, increasing travel and
product premiumization, the luggage industry has posted a 13%+ CAGR in the
past decade and is expected to maintain this momentum for next few years. With
GST implementation in 2017, the new cost dynamics has further led to industry
shifting towards organized players.
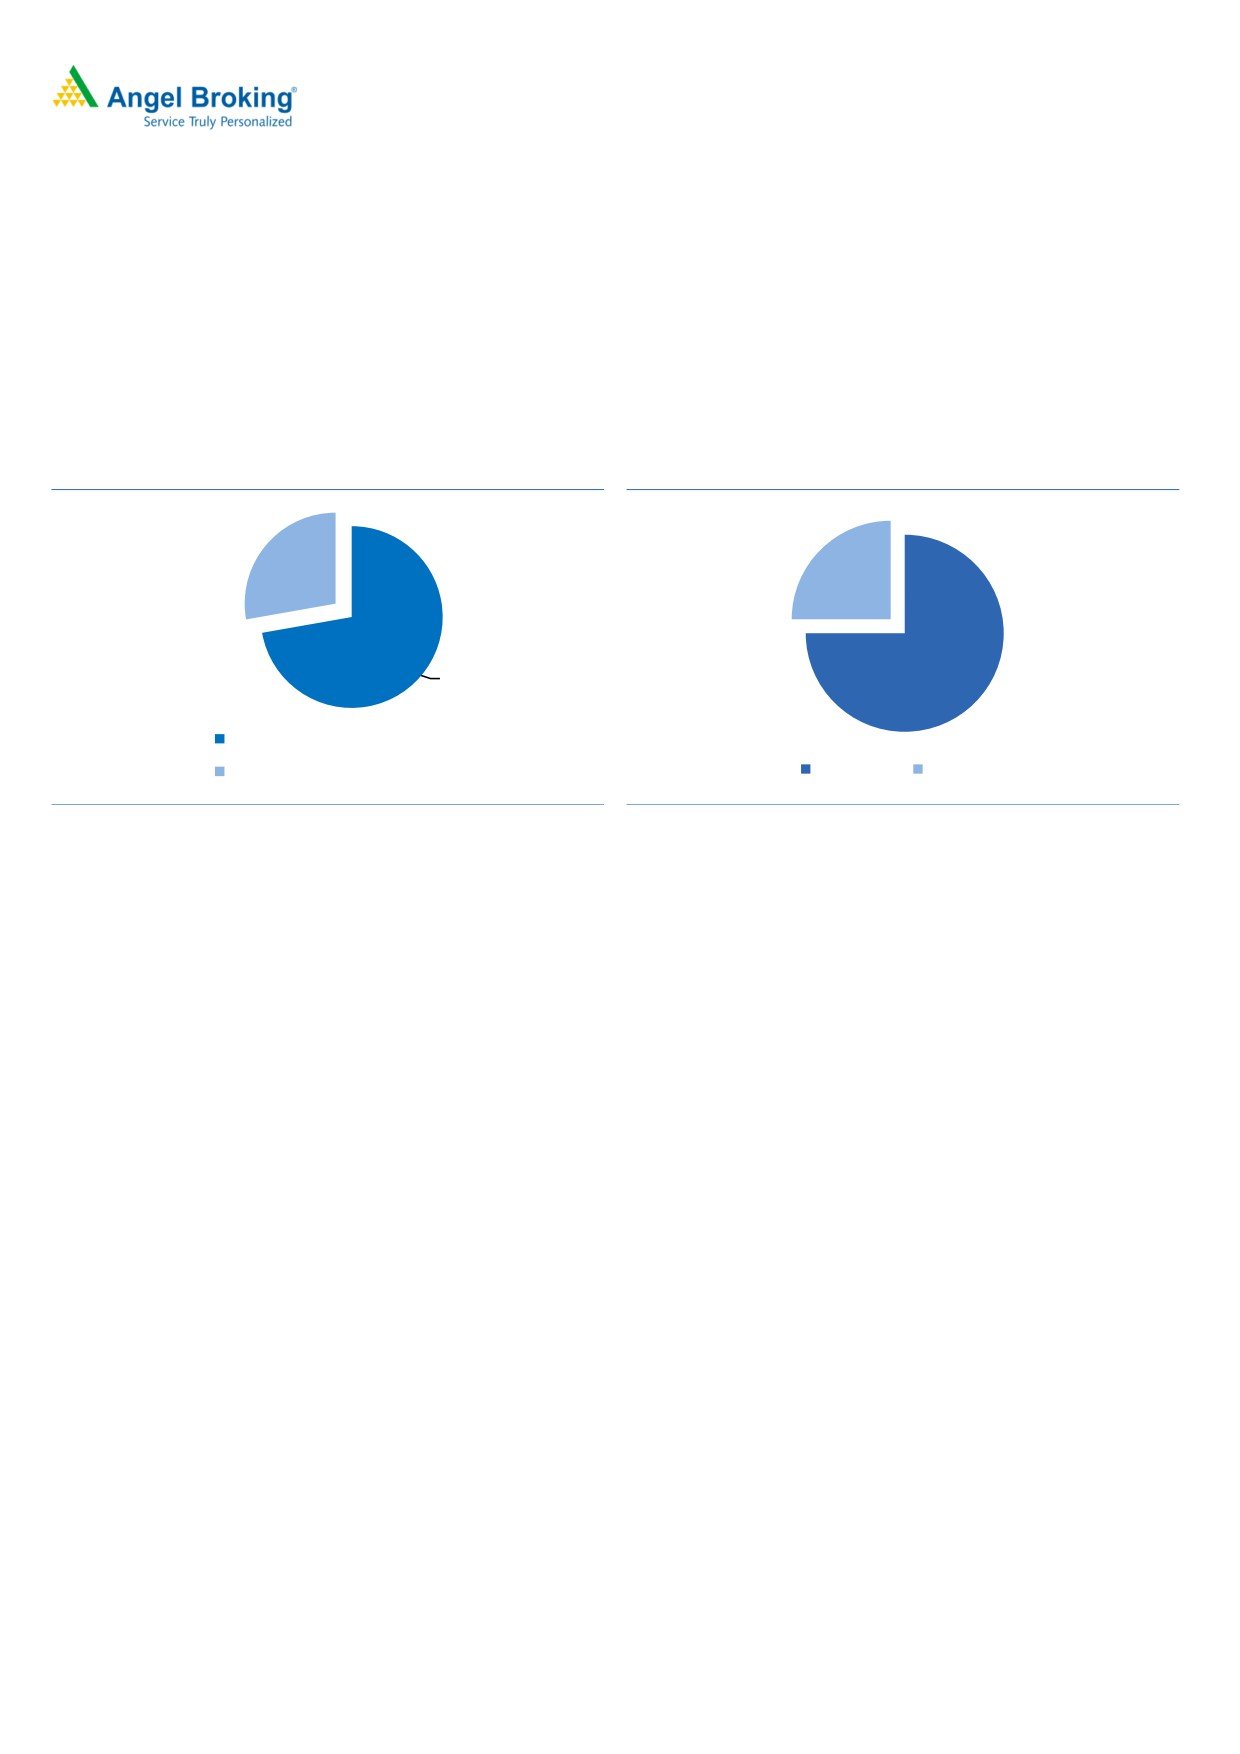
Exhibit 5: Organised v/s unorganised market share
Exhibit 6: Segment wise break-up
25%
28%
72%
75%
Market size of unorganised players
Top three players combined share
Soft Luggage
Hard Luggage
Source: Industry, Angel Research
Source: Industry, Angel Research
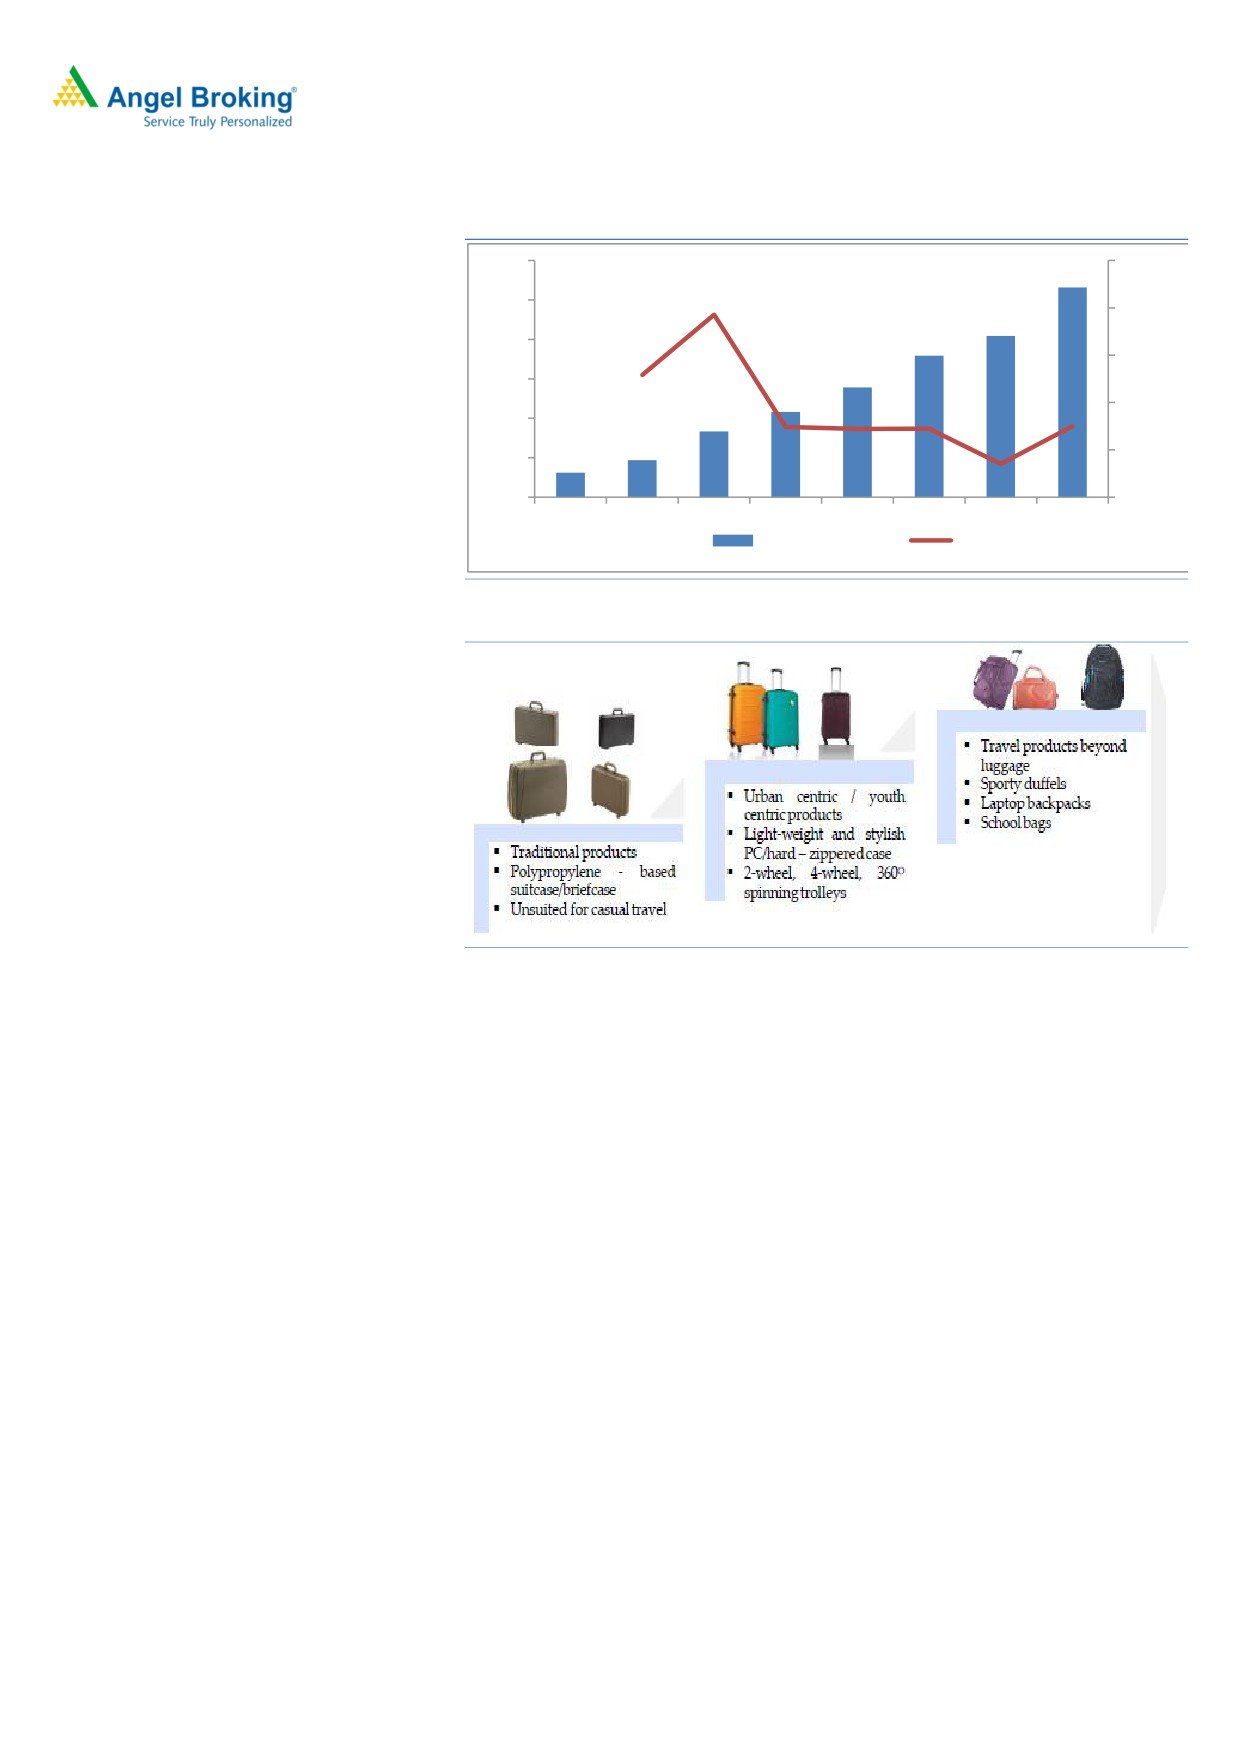
Company on a strong growth trajectory since 2012
In 2012, the company was taken over by Mr Sudhir Jatia who was previously MD
with VIP industries. Since then there has been business restructuring where lot of
new products were introduced and old non selling SKUs were discontinued. The
company now largely procures quality products ( specially in soft luggage) from
China and sell it under its brand Safari.
Post the management change, Safari has grown its revenue by 6x in the last 7
years. This has been achieved by foraying in many new categories like back pack,
school bags ( via acquisition of Genius and Genie in 2015) and improvement in
distribution networks.
Also, it adopted product rationalization & strategy realignment where non
performing SKUs were eliminated. Currently, its products are available in major
25+ cities via 3,500+ outlets.
4
Initiating Coverage
Safari Industries
Exhibit 7: Revenues shown strong growth
600
100%
500
80%
400
60%
300
40%
200
20%
100
0
0%
FY12 FY13 FY14 FY15 FY16 FY17 FY18 FY19
Net Sales- Rs cr
% chg
Source: Company, Angel Research
Exhibit 8: Revamped the product portfolio to suit the changing trends
Source: Company, Angel Research
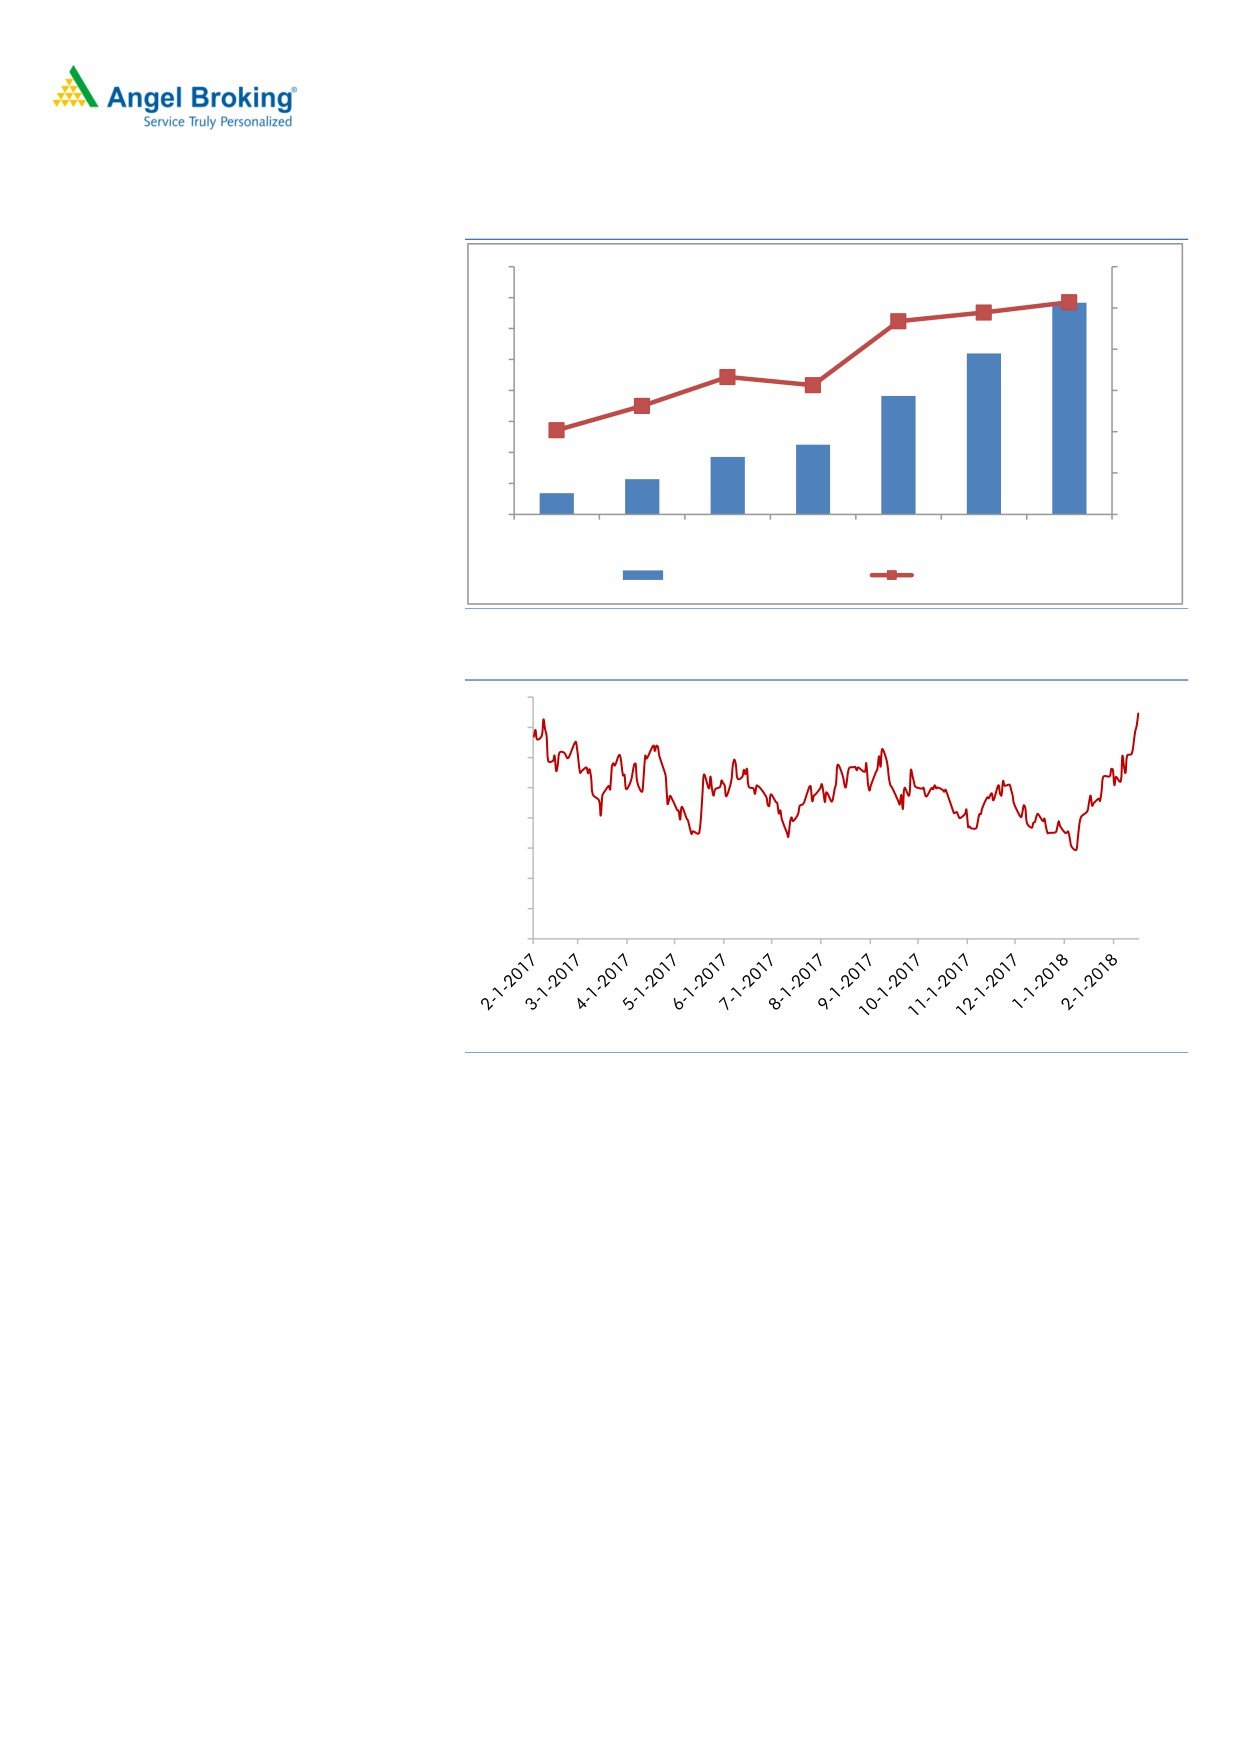
Margins have doubled and likely to stay at 9%+ level
The company has more than doubled its margins from 4.1% in FY2014 to 9.1% in
M9FY2018, driven by launch of new product categories and product
premiumization. This was also led by better negotiation with Chinese suppliers
(with increasing scale of Safari’s operations) and relatively stable INR exchange
rate and depreciation of Chinese Yuan.
VIP’s 80% revenue comes from soft luggage, which is imported from China.
However, with closure of many luggage units in China (owing to pollution
concerns), the surviving suppliers have started taking price hikes which is likely to
put pressure on margins. We expect the company to largely post 9%+ margins
from FY2018 onwards led by regular price hikes, shift towards organised player
post GST and favourable industry dynamics.
5
Initiating Coverage
Safari Industries
Exhibit 9: Improving margin profile
80
12.0%
70
10.0%
60
8.0%
50
40
6.0%
30
4.0%
20
2.0%
10
0
0.0%
FY14
FY15
FY16
FY17
FY18
FY19
FY20
Operating profit/ EBITDA
Operating margin
Source: Company, Angel Research
Exhibit 10: Yen is showing strength against rupee since January 2018
61
60
59
58
57
56
55
54
53
Source: Company, Angel Research
Outlook
Going ahead, we expect Safari to report a top-line CAGR of ~23% over FY207-
20E on the back of growth in its recently introduced new products and improving
distribution network. Further, GST implementation will also boost the volume of
branded sales. On the bottom-line front, we expect the company to report ~59%
CAGR over FY2017-20E on a small base, owing to stable operating margins and
product premiumization. The stock has turned 5x in last 4 years, however we feel
that the company with its aggressive track record and pricing strategy will continue
to post better growth than its peers like VIP and Samsonite although on a smaller
base.
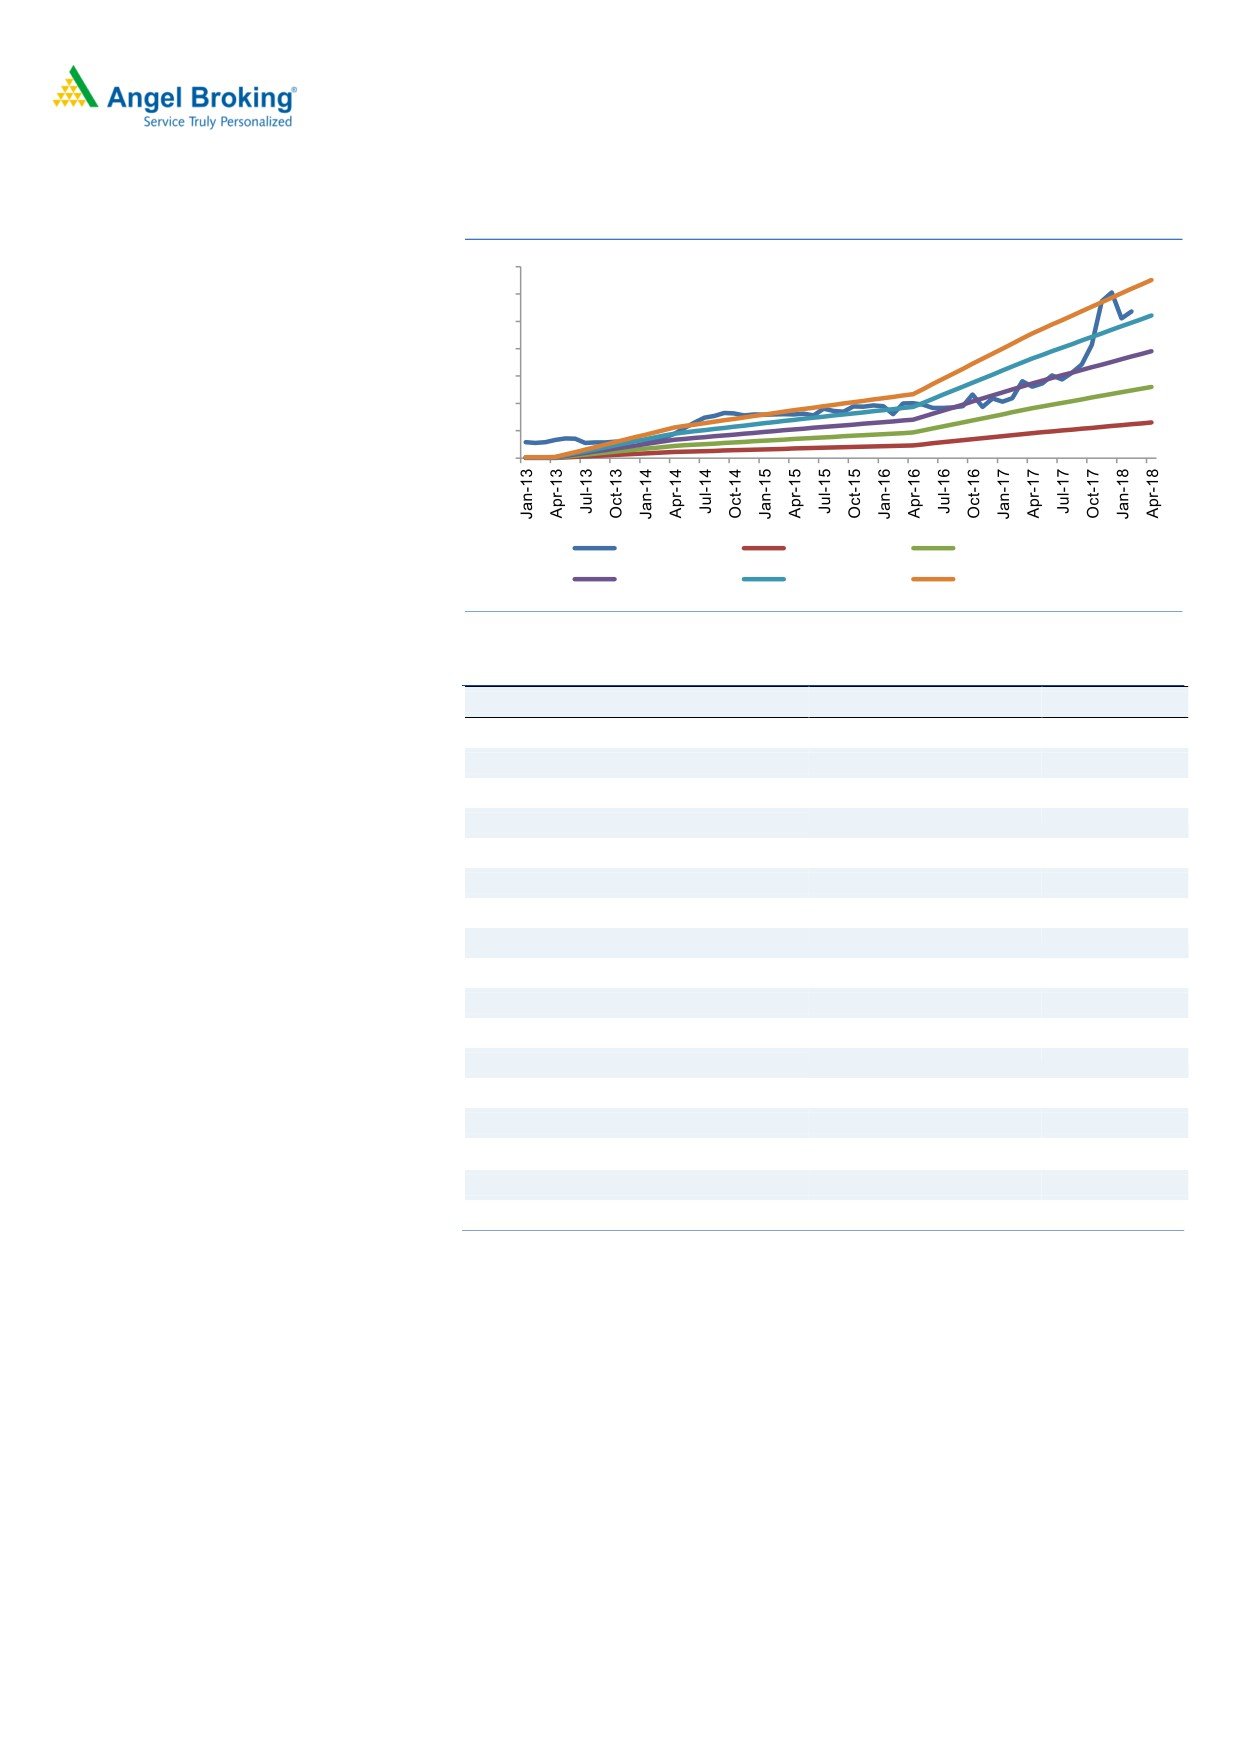
Valuation
Safari currently trades at a P/E of 40x FY2019E and 30x its FY2020E EPS which
looks reasonable looking at its strong growth trajectory and its strong brand play
story emerging in the luggage industry. Its M9FY2018 results has shown a yearly
growth of 112% in net profits. We Initiate Coverage on the stock with a Buy
recommendation and Target Price of `650 (36x FY2020E EPS), indicating an
upside of ~18% from the current levels.
6
Initiating Coverage
Safari Industries
Exhibit 11: One year forward PE chart
700
600
500
400
300
200
100
0
Close -Unit Curr
10.0 X
20.0 X
30.0 X
40.0 X
50.0 X
Source: Company, Angel Research
Exhibit 12: Peer comparison
Comparison
VIP Industries
Safari
Market Cap (Rs cr)
4808
1230
SKU (units)
100+
35+
Network
8000+
3500+
CAGR % (FY14-17)
Revenue
9.4%
29.2%
PAT
21.9%
204.4%
Average OPM
8.8%
5.3%
Projections- FY2019
Revenue
1693
532
PAT
128
29
Valuations FY2019
EV/ EBITDA
23.4
24.2
P/E
39.4
40.4
Return%- FY2019
ROE
24.6%
20.1%
ROCE
35.1%
26.3%
Source: Company, Angel Research
Risks and concerns
Volatility in foreign currency could impact the company’s profitability (80% of
its revenue comes from soft luggage, which is imported from China).
With closure of many luggage units in China (owing to pollution concerns), the
surviving suppliers have started taking price hikes which could put pressure on
its margins, unless price hike is taken.
Increase in competition from unorganized players could impact overall growth
of the company
Safari’s 20% sales comes from hard luggage segment and any increase in
input cost (most of the key raw material is polypropylene and aluminum) could
negatively impact profitability
7
Initiating Coverage
Safari Industries
Profit & Loss Statement
Y/E March (` cr)
FY2016
FY2017
FY2018E
FY2019E
FY2020E
Total operating income
278
359
409
532
665
% chg
28.8
29.0
14.0
30.0
25.0
Total Expenditure
260
336
371
480
596
Raw Material
173
219
238
307
380
Personnel
29
41
47
61
77
Selling and Administration Expenses
48.1
65.4
73.6
95.7
119.6
Others Expenses
9
10
12
16
19
EBITDA
19
22
38
52
68
% chg
63.1
21.3
70.4
35.9
31.4
(% of Net Sales)
6.7
6.3
9.4
9.8
10.3
Depreciation& Amortisation
4
5
6
7
7
EBIT
14
17
32
45
61
% chg
70.7
20.0
86.3
40.8
34.7
(% of Net Sales)
5.2
4.8
7.9
8.5
9.2
Interest & other Charges
3
3
3
3
3
Other Income
1
1
1
2
2
(% of PBT)
6.5
7.4
4.3
3.6
3.2
Share in profit of Associates
-
-
-
-
-
Recurring PBT
12
15
30
44
60
% chg
105.9
25.2
103.9
43.6
36.4
Tax
4
5
10
14
20
(% of PBT)
35.2
34.1
33.0
33.0
33.0
PAT (reported)
8
10
20
29
40
Extraordinary Items
(0)
(1)
-
-
-
ADJ. PAT
8
10
20
29
40
% chg
55.9
33.8
96.2
43.6
36.4
(% of Net Sales)
2.8
2.9
5.0
5.5
6.0
Fully Diluted EPS (Rs)
3.5
4.7
9.2
13.2
18.0
% chg
55.9
33.8
96.2
43.6
36.4
Source: Company, Angel Research
8
Initiating Coverage
Safari Industries
Balance Sheet
Y/E March (` cr)
FY2016
FY2017
FY2018E
FY2019E FY2020E
SOURCES OF FUNDS
Equity Share Capital
4
4
4
4
4
Reserves& Surplus
87
96
115
141
178
Shareholders Funds
91
100
119
146
182
Equity Share Warrants
-
-
-
-
-
Total Loans
58
44
46
48
50
Deferred Tax Liability
-
-
-
-
-
Total Liabilities
149
143
165
194
233
APPLICATION OF FUNDS
Gross Block
42
45
50
55
60
Less: Acc. Depreciation
18
22
28
34
42
Net Block
24
23
22
21
19
Capital Work-in-Progress
-
1
1
1
1
Investments
-
-
-
-
-
Current Assets
143
165
197
240
295
Inventories
76
94
105
134
164
Sundry Debtors
54
58
64
77
93
Cash
5
5
19
18
25
Loans & Advances
8
7
8
11
13
Other Assets
-
-
-
-
-
Current liabilities
27
54
65
78
94
Net Current Assets
116
110
132
161
202
Deferred Tax Asset
(0)
(0)
(0)
(0)
(0)
Total Assets
149
143
165
194
233
Source: Company, Angel Research
9
Initiating Coverage
Safari Industries
Cashflow Statement
Y/E March (` cr)
FY2016
FY2017
FY2018E FY2019E FY2020E
Profit before tax
12
15
30
44
60
Depreciation
4
5
6
7
7
Change in Working Capital
0
0
(7)
(31)
(33)
Interest / Dividend (Net)
3
3
3
3
3
Direct taxes paid
(4)
(5)
(10)
(14)
(20)
Others
(28)
4
2
(1)
(1)
Cash Flow from Operations
(13)
22
25
7
17
(Inc.)/ Dec. in Fixed Assets
(16)
(5)
(5)
(5)
(5)
(Inc.)/ Dec. in Investments
1
(1)
0
0
0
Cash Flow from Investing
(15)
(6)
(5)
(5)
(5)
Issue of Equity
7
0
0
0
0
Inc./(Dec.) in loans
3
1
2
2
2
Dividend Paid (Incl. Tax)
0
(16)
(2)
(2)
(3)
Interest / Dividend (Net)
(3)
(3)
(3)
(3)
(3)
Cash Flow from Financing
29
(17)
(3)
(3)
(4)
Inc./(Dec.) in Cash
1
(2)
17
(1)
8
Opening Cash balances
3
4
2
19
18
Closing Cash balances
4
2
19
18
25
Source: Company, Angel Research
10
Initiating Coverage
Safari Industries
Key Ratios
Y/E March
FY2016
FY2017
FY2018E
FY2019E FY2020E
Valuation Ratio (x)
P/E (on FDEPS)
152.1
113.7
58.0
40.4
29.6
P/CEPS
101.0
79.6
45.2
33.3
25.3
P/BV
13.1
11.9
10.0
8.2
6.5
Dividend yield (%)
0.0
0.1
0.1
0.2
0.3
EV/Sales
4.4
3.4
3.0
2.3
1.8
EV/EBITDA
66.8
54.4
31.6
23.3
17.7
EV / Total Assets
8.3
8.5
7.3
6.3
5.2
Per Share Data (`)
EPS (Basic)
3.5
4.7
9.2
13.2
18.0
EPS (fully diluted)
3.5
4.7
9.2
13.2
18.0
Cash EPS
5.3
6.7
11.9
16.1
21.2
DPS
0.2
0.4
0.8
1.1
1.5
Book Value
40.9
44.9
53.5
65.5
82.0
Returns (%)
ROCE
9.7
12.1
19.6
23.5
26.3
Angel ROIC (Pre-tax)
10.0
12.5
22.2
25.8
29.5
ROE
8.5
10.4
17.2
20.1
21.9
Turnover ratios (x)
Asset Turnover (Gross Block)
6.6
7.9
8.1
9.6
11.0
Inventory / Sales (days)
100
96
94
92
90
Receivables (days)
71
59
57
53
51
Payables (days)
92
141
137
125
118
Working capital cycle (ex-cash) (days)
80
14
15
20
23
Source: Company, Angel Research
11
Initiating Coverage
Safari Industries
Research Team Tel: 022 - 39357800
DISCLAIMER
Angel Broking Private Limited (hereinafter referred to as “Angel”) is a registered Member of National Stock Exchange of India Limited,
Bombay Stock Exchange Limited and Metropolitan Stock Exchange Limited. It is also registered as a Depository Participant with CDSL
and Portfolio Manager with SEBI. It also has registration with AMFI as a Mutual Fund Distributor. Angel Broking Private Limited is a
registered entity with SEBI for Research Analyst in terms of SEBI (Research Analyst) Regulations, 2014 vide registration number
INH000000164. Angel or its associates has not been debarred/ suspended by SEBI or any other regulatory authority for accessing
/dealing in securities Market. Angel or its associates/analyst has not received any compensation / managed or co-managed public
offering of securities of the company covered by Analyst during the past twelve months.
This document is solely for the personal information of the recipient, and must not be singularly used as the basis of any investment
decision. Nothing in this document should be construed as investment or financial advice. Each recipient of this document should
make such investigations as they deem necessary to arrive at an independent evaluation of an investment in the securities of the
companies referred to in this document (including the merits and risks involved), and should consult their own advisors to determine
the merits and risks of such an investment.
Reports based on technical and derivative analysis center on studying charts of a stock's price movement, outstanding positions and
trading volume, as opposed to focusing on a company's fundamentals and, as such, may not match with a report on a company's
fundamentals. Investors are advised to refer the Fundamental and Technical Research Reports available on our website to evaluate the
contrary view, if any.
The information in this document has been printed on the basis of publicly available information, internal data and other reliable
sources believed to be true, but we do not represent that it is accurate or complete and it should not be relied on as such, as this
document is for general guidance only. Angel Broking Pvt. Limited or any of its affiliates/ group companies shall not be in any way
responsible for any loss or damage that may arise to any person from any inadvertent error in the information contained in this report.
Angel Broking Pvt. Limited has not independently verified all the information contained within this document. Accordingly, we cannot
testify, nor make any representation or warranty, express or implied, to the accuracy, contents or data contained within this document.
While Angel Broking Pvt. Limited endeavors to update on a reasonable basis the information discussed in this material, there may be
regulatory, compliance, or other reasons that prevent us from doing so.
This document is being supplied to you solely for your information, and its contents, information or data may not be reproduced,
redistributed or passed on, directly or indirectly.
Neither Angel Broking Pvt. Limited, nor its directors, employees or affiliates shall be liable for any loss or damage that may arise from
or in connection with the use of this information.
Disclosure of Interest Statement
Safari Industries
1. Financial interest of research analyst or Angel or his Associate or his relative
No
2. Ownership of 1% or more of the stock by research analyst or Angel or associates or relatives
No
3. Served as an officer, director or employee of the company covered under Research
No
4. Broking relationship with company covered under Research
No
12